<?xml version="1.0" encoding="utf-8"?><feed xmlns="http://www.w3.org/2005/Atom" ><generator uri="https://jekyllrb.com/" version="3.10.0">Jekyll</generator><link href="https://jagodwin.github.io/feed.xml" rel="self" type="application/atom+xml" /><link href="https://jagodwin.github.io/" rel="alternate" type="text/html" /><updated>2026-07-20T17:47:11+00:00</updated><id>https://jagodwin.github.io/feed.xml</id><title type="html">Alex Godwin | CS Prof @ American University</title><subtitle>I am an Associate Professor in the Computer Science Department at American University. My research is focused on using information visualization and novel interaction techniques to make civic data more accessible.</subtitle><author><name>Alex Godwin, Ph.D</name></author><entry><title type="html">🏆 Interaction Techniques for Providing Sensitive Location Data of Interpersonal Violence with User-Defined Privacy Preservation</title><link href="https://jagodwin.github.io/research/VIIPR-CHI/" rel="alternate" type="text/html" title="🏆 Interaction Techniques for Providing Sensitive Location Data of Interpersonal Violence with User-Defined Privacy Preservation" /><published>2025-04-25T00:00:00+00:00</published><updated>2025-04-25T00:00:00+00:00</updated><id>https://jagodwin.github.io/research/VIIPR-CHI</id><content type="html" xml:base="https://jagodwin.github.io/research/VIIPR-CHI/"><![CDATA[<p><img src="https://jagodwin.github.io/assets/images/viipr_teaser.png" alt="UI teaser" /></p>

<p>Our work on privacy-preserving collection of patient data on violent incidents has been accepted to the SIGCHI Conference on Human Factors in Computing Systems! In this paper, we talk about our technique for helping to fill in the gaps in violent incident data, and present a technique and system to collect data for those gaps.</p>

<p>🏆Honorable Mention at CHI 2025!</p>

<h2 id="abstract">Abstract</h2>
<p>Violence is a significant public health issue. Interventions to reduce violence rely on data about where incidents occur. Cities have historically used incomplete law enforcement crime data, but many are shifting toward data collected from hospital patients via the Cardiff Model to form a more complete understanding of violence. Still, location data is wrought with issues related to completeness, quality, and privacy. For example, if a patient feels that sharing a detailed location may present them with additional risks, such as undesired police involvement or retaliatory violence, they may be unwilling or unable to share. Consequently, survivors of violence who are the most vulnerable may remain the most at risk. We have designed a user interface and mapping algorithm to confront these challenges and conducted an experiment with emergency department patients. The results indicate a significant improvement in location data obtained using the interface compared to the existing screening interview.</p>

<h2 id="citation-and-link">Citation and Link</h2>

<p>Alex Godwin, Jasmine C Foriest, Mia Bottcher, Gretchen Baas, Michael Tsai, and Daniel T Wu. 2025. Interaction Techniques for Providing Sensitive Location Data of Interpersonal Violence with User-Defined Privacy Preservation. In Proceedings of the 2025 CHI Conference on Human Factors in Computing Systems (CHI ‘25). Association for Computing Machinery, New York, NY, USA, Article 904, 1–18. <a href="https://doi.org/10.1145/3706598.3714136">https://doi.org/10.1145/3706598.3714136</a></p>]]></content><author><name>Alex Godwin, Ph.D</name></author><category term="research" /><category term="research," /><category term="conference" /><category term="papers" /><summary type="html"><![CDATA[Our work on privacy-preserving collection of patient data on violent incidents has been accepted to the SIGCHI Conference on Human Factors in Computing Systems! In this paper, we talk about our technique for helping to fill in the gaps in violent incident data, and present a technique and system to collect data for those gaps. 🏆Honorable Mention at CHI 2025! Abstract Violence is a significant public health issue. Interventions to reduce violence rely on data about where incidents occur. Cities have historically used incomplete law enforcement crime data, but many are shifting toward data collected from hospital patients via the Cardiff Model to form a more complete understanding of violence. Still, location data is wrought with issues related to completeness, quality, and privacy. For example, if a patient feels that sharing a detailed location may present them with additional risks, such as undesired police involvement or retaliatory violence, they may be unwilling or unable to share. Consequently, survivors of violence who are the most vulnerable may remain the most at risk. We have designed a user interface and mapping algorithm to confront these challenges and conducted an experiment with emergency department patients. The results indicate a significant improvement in location data obtained using the interface compared to the existing screening interview. Citation and Link Alex Godwin, Jasmine C Foriest, Mia Bottcher, Gretchen Baas, Michael Tsai, and Daniel T Wu. 2025. Interaction Techniques for Providing Sensitive Location Data of Interpersonal Violence with User-Defined Privacy Preservation. In Proceedings of the 2025 CHI Conference on Human Factors in Computing Systems (CHI ‘25). Association for Computing Machinery, New York, NY, USA, Article 904, 1–18. https://doi.org/10.1145/3706598.3714136]]></summary></entry><entry><title type="html">Globalization of wild capture and farmed aquatic foods</title><link href="https://jagodwin.github.io/research/HNDS-Nature/" rel="alternate" type="text/html" title="Globalization of wild capture and farmed aquatic foods" /><published>2024-09-13T00:00:00+00:00</published><updated>2024-09-13T00:00:00+00:00</updated><id>https://jagodwin.github.io/research/HNDS-Nature</id><content type="html" xml:base="https://jagodwin.github.io/research/HNDS-Nature/"><![CDATA[<p><img src="https://jagodwin.github.io/assets/images/trawler.jpg" alt="fishing trawler" /></p>
<blockquote>
  <p>Photo by <a href="https://unsplash.com/@pauleinerhand?utm_source=unsplash&amp;utm_medium=referral&amp;utm_content=creditCopyText">Paul Einerhand</a> on <a href="https://unsplash.com/s/photos/fishery?utm_source=unsplash&amp;utm_medium=referral&amp;utm_content=creditCopyText">Unsplash</a></p>
</blockquote>

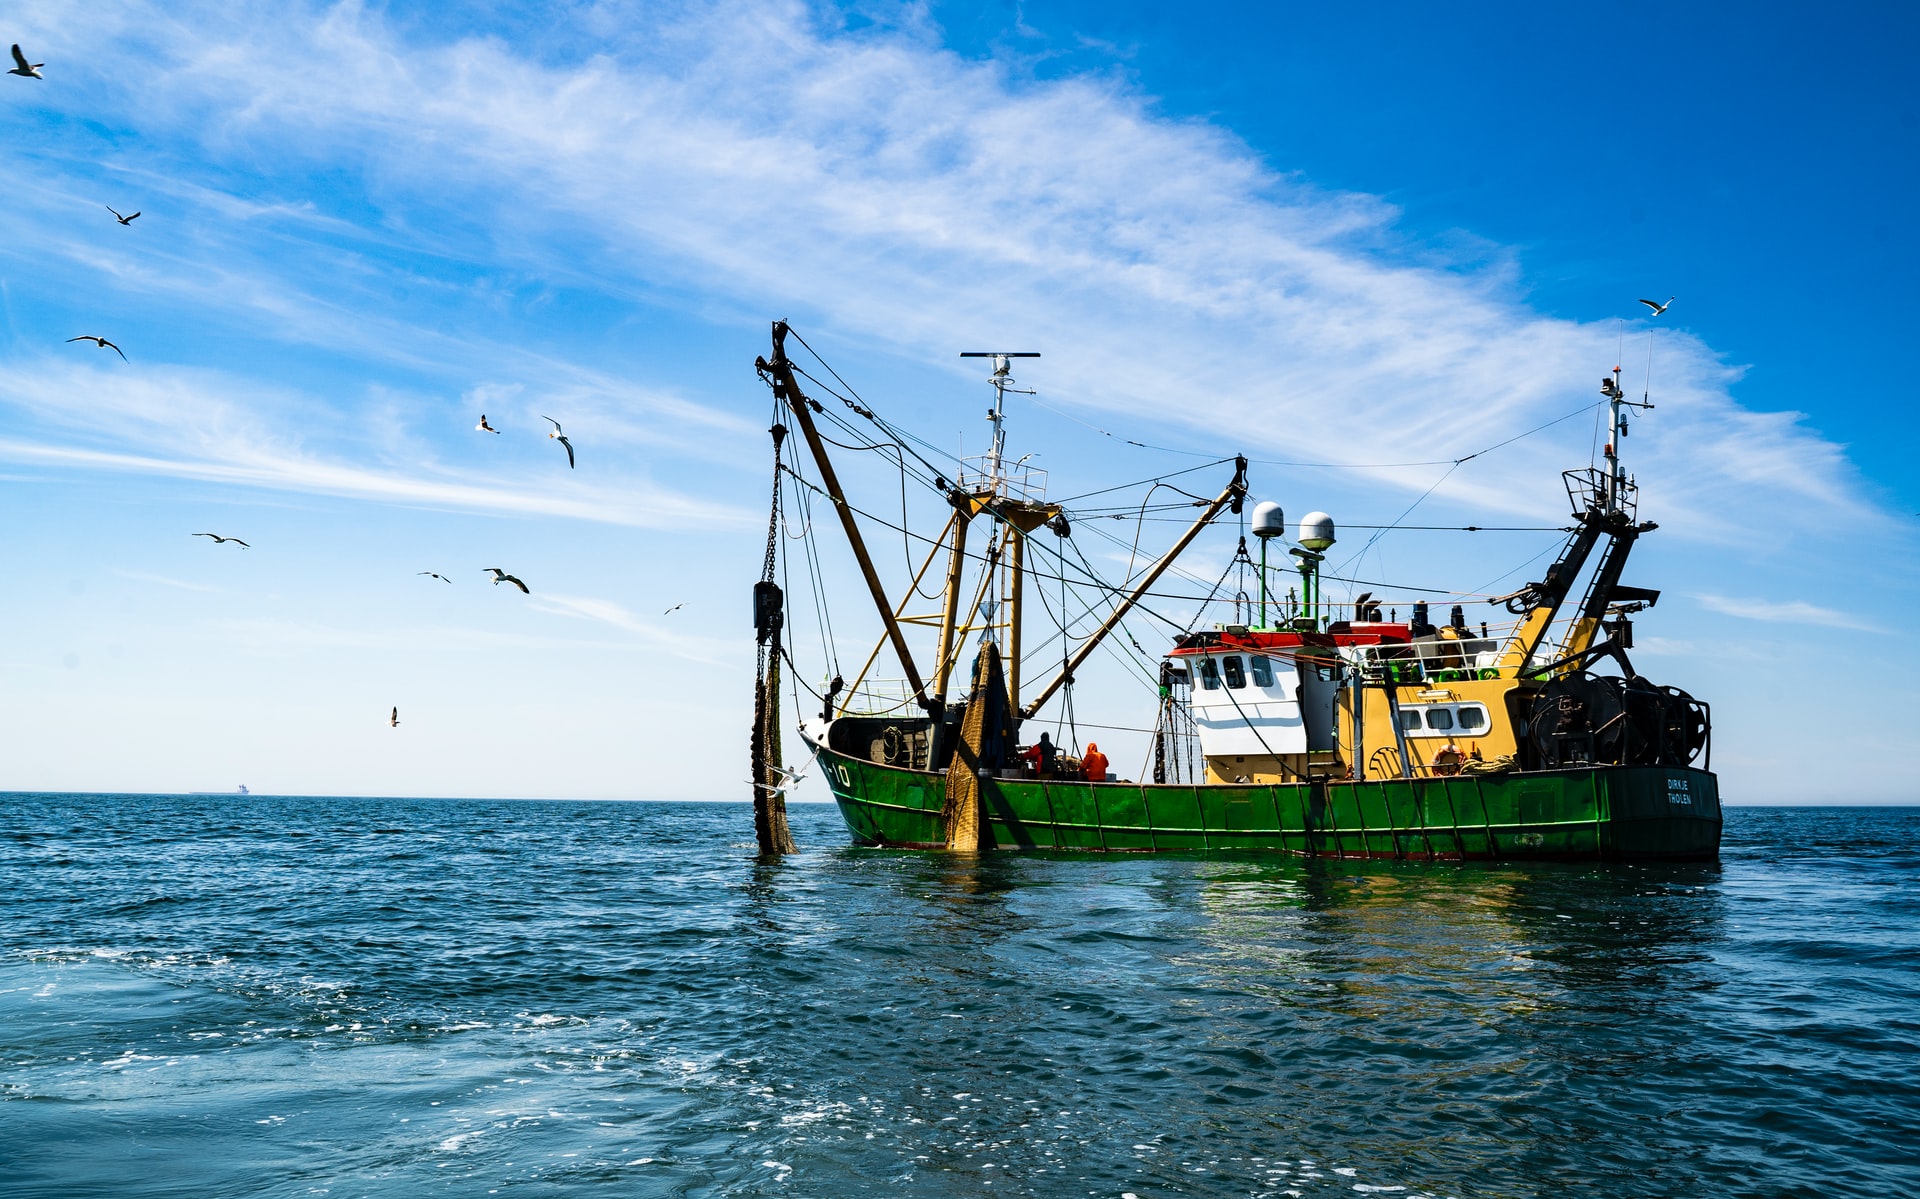
<p>Our work on ARTIS has been accepted to Nature Communications! In this paper, we talk about some early findings from the database.</p>

<h2 id="abstract">Abstract</h2>
<p>Aquatic foods are highly traded, with nearly 60 million tonnes exported in 2020, representing 11% of global agriculture trade by value. Despite the vast scale, basic characteristics of aquatic food trade, including species, origin, and farmed vs wild sourcing, are largely unknown due to the reporting of trade data. Consequently, we have a coarse picture of aquatic food trade and consumption patterns. Here, we present results from a database on species trade that aligns production, conversion factors, and trade to compute apparent consumption for all farmed and wild aquatic foods from 1996 to 2020. Over this period, aquatic foods became increasingly globalized, with the share of production exported increasing by 40%. Importantly, trends differ across aquatic food sectors. Global consumption also increased by 19.4% despite declining marine capture consumption, and some regions became increasingly reliant on foreign-sourced aquatic foods. To identify sustainable diet opportunities among aquatic foods, our findings, and underlying database enable a greater understanding of the role of trade in rapidly evolving aquatic food systems.</p>

<h2 id="citation-and-link">Citation and Link</h2>

<p>Gephart, J. A., Agrawal Bejarano, R., Gorospe, K., Godwin, A., Golden, C. D., Naylor, R. L., … &amp; Troell, M. (2024). Globalization of wild capture and farmed aquatic foods. Nature Communications, 15(1), 8026.
<a href="https://www.nature.com/articles/s41467-024-51965-8">link:</a></p>

<h2 id="link-to-the-dataset">Link to the dataset</h2>

<p><a href="https://knb.ecoinformatics.org/view/doi%3A10.5063%2FF1CZ35N7">link:</a></p>]]></content><author><name>Alex Godwin, Ph.D</name></author><category term="research" /><category term="research," /><category term="journal" /><category term="papers" /><summary type="html"><![CDATA[Photo by Paul Einerhand on Unsplash Our work on ARTIS has been accepted to Nature Communications! In this paper, we talk about some early findings from the database. Abstract Aquatic foods are highly traded, with nearly 60 million tonnes exported in 2020, representing 11% of global agriculture trade by value. Despite the vast scale, basic characteristics of aquatic food trade, including species, origin, and farmed vs wild sourcing, are largely unknown due to the reporting of trade data. Consequently, we have a coarse picture of aquatic food trade and consumption patterns. Here, we present results from a database on species trade that aligns production, conversion factors, and trade to compute apparent consumption for all farmed and wild aquatic foods from 1996 to 2020. Over this period, aquatic foods became increasingly globalized, with the share of production exported increasing by 40%. Importantly, trends differ across aquatic food sectors. Global consumption also increased by 19.4% despite declining marine capture consumption, and some regions became increasingly reliant on foreign-sourced aquatic foods. To identify sustainable diet opportunities among aquatic foods, our findings, and underlying database enable a greater understanding of the role of trade in rapidly evolving aquatic food systems. Citation and Link Gephart, J. A., Agrawal Bejarano, R., Gorospe, K., Godwin, A., Golden, C. D., Naylor, R. L., … &amp; Troell, M. (2024). Globalization of wild capture and farmed aquatic foods. Nature Communications, 15(1), 8026. link: Link to the dataset link:]]></summary></entry><entry><title type="html">Paths Through Spatial Networks</title><link href="https://jagodwin.github.io/research/Paths-Networks-VIS/" rel="alternate" type="text/html" title="Paths Through Spatial Networks" /><published>2022-10-16T00:00:00+00:00</published><updated>2022-10-16T00:00:00+00:00</updated><id>https://jagodwin.github.io/research/Paths-Networks-VIS</id><content type="html" xml:base="https://jagodwin.github.io/research/Paths-Networks-VIS/"><![CDATA[<p><img src="https://jagodwin.github.io/assets/images/paths_networks.png" alt="UI teaser" /></p>

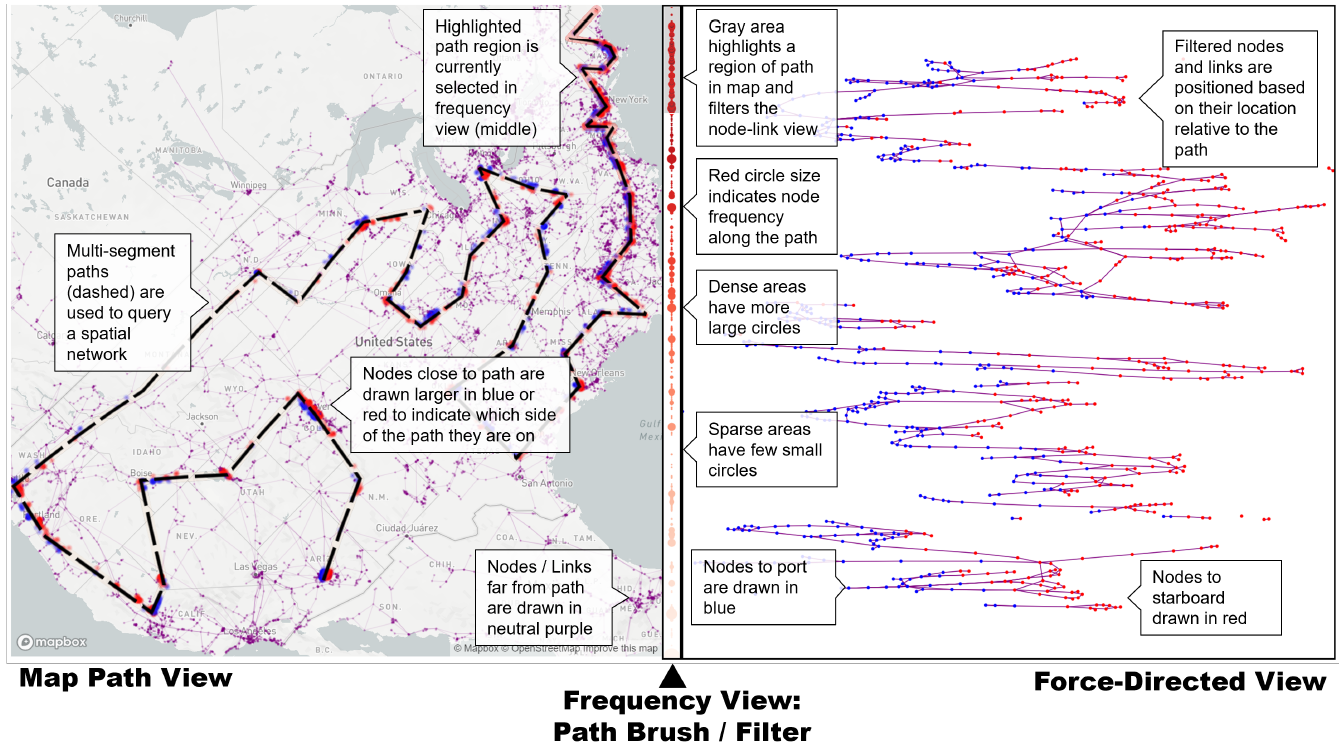
<p>My work on spatial network visualization will be presented at IEEE VIS in Oklahoma City! This combines an interactive spatial and linked network view to let you explore both at the same time.</p>

<h2 id="abstract">Abstract</h2>
<p>Spatial networks present unique challenges to understanding topological
structure. Each node occupies a location in physical space
(e.g., longitude and latitude) and each link may either indicate a fixed
and well-described path (e.g., along streets) or a logical connection
only. Placing these elements in a map maintains these physical
relationships while making it more difficult to identify topological
features of interest such as clusters, cliques, and paths. While some
systems provide coordinated representations of a spatial network,
it is almost universally assumed that the network itself is the sole
mechanism for movement across space. In this paper, I present a
novel approach for exploring spatial networks by orienting them
along a point or path in physical space that provides the guide for
parameters in a force-directed layout. By specifying a path across
topography, networks can be spatially filtered independently of the
topology of the network. Initial case studies indicate promising
results for exploring spatial networks in transportation and energy
distribution.</p>

<h2 id="citation-and-link">Citation and Link</h2>
<p>Godwin, A. (2022, October). Paths through spatial networks. In 2022 IEEE Visualization and Visual Analytics (VIS) (pp. 31-34). IEEE.
<a href="https://ieeexplore.ieee.org/abstract/document/9973200">Link:</a></p>]]></content><author><name>Alex Godwin, Ph.D</name></author><category term="research" /><category term="research," /><category term="conference" /><category term="papers" /><summary type="html"><![CDATA[]]></summary></entry><entry><title type="html">Visualization for On and Off the Rails: Train Commuting Dashboards for DC</title><link href="https://jagodwin.github.io/research/Rails-VIS/" rel="alternate" type="text/html" title="Visualization for On and Off the Rails: Train Commuting Dashboards for DC" /><published>2022-10-16T00:00:00+00:00</published><updated>2022-10-16T00:00:00+00:00</updated><id>https://jagodwin.github.io/research/Rails-VIS</id><content type="html" xml:base="https://jagodwin.github.io/research/Rails-VIS/"><![CDATA[<p><img src="https://jagodwin.github.io/assets/images/wmata-dashboard.png" alt="UI teaser" /></p>

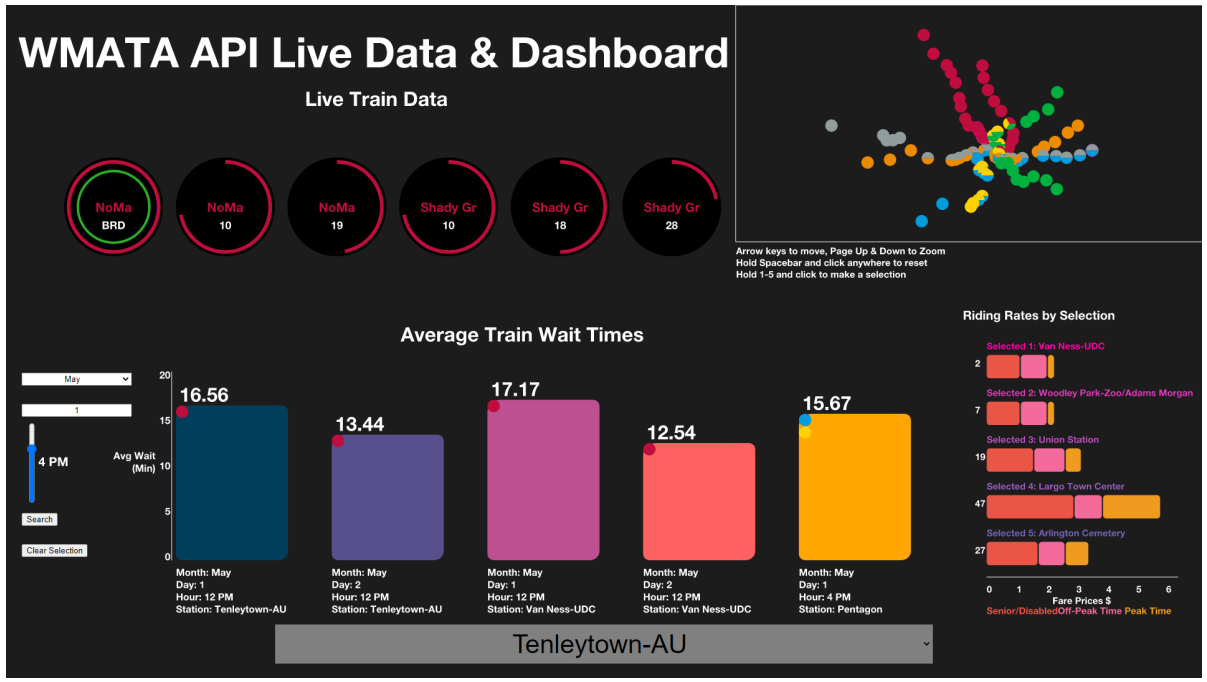
<p>Our work on public train visualization will be presented at IEEE VIS in Oklahoma City! This is student-led work by two amazing undergraduate students, Jacob Rosen and Jeff Zhang. This started as a student project in my InfoVis class and they did a fantastic job in getting it ready for VIS.</p>

<h2 id="abstract">Abstract</h2>
<p>The Metro API Data Visualization project (MetroVis) balances passive display capabilities for commuters with interactive queries to visualize Washington Metropolitan Area Transit Authority’s (WMATA) live and historic transportation data. MetroVis is designed for commuters of two types: those that have to rapidly make decisions and catch a train, and those that have a moment to wait.For commuters that have to rapidly determine which train is arriving and how much time they have to catch it, MetroVis displays relevant information about a location that can be discerned at a glance. For commuters that have a moment to interact with the display while waiting for a train, MetroVis presents several dynamic and interactive features that allow commuters to quickly find information</p>

<h2 id="citation-and-link">Citation and Link</h2>

<p><a href="https://ieeevis.b-cdn.net/vis_2022/posters/v-vis-posters-1045-summary.pdf">Link:</a></p>]]></content><author><name>Alex Godwin, Ph.D</name></author><category term="research" /><category term="research," /><category term="conference" /><category term="posters" /><summary type="html"><![CDATA[Our work on public train visualization will be presented at IEEE VIS in Oklahoma City! This is student-led work by two amazing undergraduate students, Jacob Rosen and Jeff Zhang. This started as a student project in my InfoVis class and they did a fantastic job in getting it ready for VIS. Abstract The Metro API Data Visualization project (MetroVis) balances passive display capabilities for commuters with interactive queries to visualize Washington Metropolitan Area Transit Authority’s (WMATA) live and historic transportation data. MetroVis is designed for commuters of two types: those that have to rapidly make decisions and catch a train, and those that have a moment to wait.For commuters that have to rapidly determine which train is arriving and how much time they have to catch it, MetroVis displays relevant information about a location that can be discerned at a glance. For commuters that have a moment to interact with the display while waiting for a train, MetroVis presents several dynamic and interactive features that allow commuters to quickly find information Citation and Link Link:]]></summary></entry><entry><title type="html">HNDS-I: A global seafood trade network database for sustainable food systems, human health, and nutrition security</title><link href="https://jagodwin.github.io/research/HNDS-I/" rel="alternate" type="text/html" title="HNDS-I: A global seafood trade network database for sustainable food systems, human health, and nutrition security" /><published>2021-08-31T00:00:00+00:00</published><updated>2021-08-31T00:00:00+00:00</updated><id>https://jagodwin.github.io/research/HNDS-I</id><content type="html" xml:base="https://jagodwin.github.io/research/HNDS-I/"><![CDATA[<p><img src="https://jagodwin.github.io/assets/images/trawler.jpg" alt="fishing trawler" /></p>
<blockquote>
  <p>Photo by <a href="https://unsplash.com/@pauleinerhand?utm_source=unsplash&amp;utm_medium=referral&amp;utm_content=creditCopyText">Paul Einerhand</a> on <a href="https://unsplash.com/s/photos/fishery?utm_source=unsplash&amp;utm_medium=referral&amp;utm_content=creditCopyText">Unsplash</a></p>
</blockquote>

<p>I’m excited to be working with the amazing <a href="http://www.jessicagephart.com/">Jessica Gephart</a> over the next few years! We will be making seafood trade data more accessible to researchers through downloadable analysis and visualization packages. More information coming soon.</p>

<h2 id="abstract">Abstract</h2>

<p>Around the world, over a quarter of all food is traded internationally. Global trade can provide foods at lower prices, supply more types of foods year-round, and resist local supply shortages, such as crop failures. At the same time, global trade has drawbacks and can pose a risk to food security. For example, environmental disasters can create supply shortages that are passed on to importing countries or nutritious foods can be redirected away from domestic markets. Seafood is an important source of nutrition around the world and is among the most highly traded foods. As a result, it is important to understand when global seafood trade either improves or threatens food and nutrition security. This grant supports the construction of a database that tracks the flows of products in the global seafood market. The database includes information on the kinds of seafood that are being traded across countries, who is selling it and who is buying it, and how this network of buyers and sellers changes over time.</p>

<p>This project constructs the Aquatic Resource Trade in Species (ARTIS) database which shows the global flow of seafood species for the first time. This database enables research on the environmental and human outcomes of food system globalization, including a better understanding of the conditions under which trade promotes environmental sustainability, human health, and food security. Research in these areas has been limited by missing data and, for the data that exist, mismatches in the taxonomic and product resolution of the data. The ARTIS database uses techniques of optimization to align public data sets. These linked datasets are joined to new data on the nutrient content of different kinds of seafood. ARTIS is available to researchers through published underlying data and code and a downloadable R package that archives the data and code. The project also develops an interactive website that will allow users to explore the seafood trade without downloading data or requiring coding skills. The ARTIS database is important for answering pressing questions about the role of global seafood trade in sustainable food production and nutrition security.</p>

<h2 id="principal-investigators">Principal Investigators</h2>
<p>Jessica  Gephart (Principal Investigator), Alex Godwin (Co-Principal Investigator)</p>

<h2 id="nsf-link">NSF Link</h2>
<p><a href="https://www.nsf.gov/awardsearch/showAward?AWD_ID=2121238&amp;HistoricalAwards=false">Award Abstract # 2121238
Collaborative Research: HNDS-I: A global seafood trade network database for sustainable food systems, human health, and nutrition security</a></p>]]></content><author><name>Alex Godwin, Ph.D</name></author><category term="research" /><category term="research," /><category term="grants" /><summary type="html"><![CDATA[This project constructs the Aquatic Resource Trade in Species (ARTIS) database for answering pressing questions about the role of global seafood trade in sustainable food production and nutrition security.]]></summary></entry><entry><title type="html">Unravelling the Human Perspective and Considerations for Urban Data Visualization</title><link href="https://jagodwin.github.io/research/humanperspective/" rel="alternate" type="text/html" title="Unravelling the Human Perspective and Considerations for Urban Data Visualization" /><published>2021-04-19T00:00:00+00:00</published><updated>2021-04-19T00:00:00+00:00</updated><id>https://jagodwin.github.io/research/humanperspective</id><content type="html" xml:base="https://jagodwin.github.io/research/humanperspective/"><![CDATA[<p><img src="https://jagodwin.github.io/assets/images/unravelling.png" alt="images from city vis workshops" /></p>

<p>Effective use of data is an essential asset to modern cities. Visualization as a tool for analysis, exploration, and communication has become a driving force in the task of unravelling our complex urban fabrics. This paper outlines the findings from a series of three workshops from 2018-2020 bringing together experts in urban data visualization with the aim of exploring multidisciplinary perspectives from the human-centric lens. Based on the rich and detailed workshop discussions identifying challenges and opportunities for urban data visualization research, we outline major human-centric themes and considerations fundamental for CityVis design and introduce a framework for an urban visualization design space.</p>

<h2 id="authors">Authors</h2>
<p>Goodwin, S., Meier, S., Bartram, L., Godwin, A., Nagel, T., and Dörk, M.</p>

<h2 id="venue">Venue</h2>
<p><a href="https://ieeexplore.ieee.org/xpl/conhome/9438711/proceeding">2021 IEEE 14th Pacific Visualization Symposium (PacificVis)</a></p>

<h2 id="materials">Materials</h2>
<p><a href="https://jagodwin.github.io/assets/papers/pacificvis2021.pdf">Paper</a></p>]]></content><author><name>Alex Godwin, Ph.D</name></author><category term="research" /><category term="research" /><summary type="html"><![CDATA[Unravelling the Human Perspective and Considerations for Urban Data Visualization.]]></summary></entry><entry><title type="html">Health Equity Monitor</title><link href="https://jagodwin.github.io/research/healthequity/" rel="alternate" type="text/html" title="Health Equity Monitor" /><published>2017-10-01T00:00:00+00:00</published><updated>2017-10-01T00:00:00+00:00</updated><id>https://jagodwin.github.io/research/healthequity</id><content type="html" xml:base="https://jagodwin.github.io/research/healthequity/"><![CDATA[<p><img src="https://jagodwin.github.io/assets/images/healthequity.png" alt="Health Equity Monitor Image" /></p>

<p>With a focus on urban health, this project intended to elicit the magnitude of health inequities in Atlanta using Millennium Development Goals (MDGs) indicators. We sought to highlight those sections of the urban population who are disadvantaged in accessing services and achieving healthy outcomes. Therefore, the project focused on providing a quick and clear understanding of the current health inequities in Atlanta. A pooled dataset was applied to obtain MDGs indicators, and then we visualized the Atlanta health profile, helping the public to gain insights about this information. We tried to expose as much statistical data as possible, but to avoid visual encodings that may bias the perception of that data. The developed visualization harbors the potential to explore the hidden inequity of different social and economic aspects, such as education, violence, transportation and so forth. Also, the visualization could potentially be extended to display city profiles besides Atlanta.</p>

<h1 id="demo">Demo</h1>
<p><a href="https://digital-cities-lab.github.io/health_viz_project/">https://digital-cities-lab.github.io/health_viz_project/</a></p>

<iframe src="https://player.vimeo.com/video/230838545?h=f5dc4d2fd4" width="640" height="360" frameborder="0" allow="autoplay; fullscreen; picture-in-picture" allowfullscreen=""></iframe>
<p><a href="https://vimeo.com/230838545">[VIS17 Preview] Equity Monitor: Visualizing Attributes of Health Inequity in Atlanta (Poster)</a> from <a href="https://vimeo.com/vgtcommunity">VGTCommunity</a> on <a href="https://vimeo.com">Vimeo</a>.</p>

<h2 id="authors">Authors</h2>
<p>Zhang, X., Godwin, A., and Stasko, J.</p>

<h2 id="venue">Venue</h2>
<p><a href="http://ieeevis.org/year/2017/welcome">2017 Proceedings of the IEEE International Conference on Visualization (VIS)</a></p>

<h2 id="materials">Materials</h2>
<p><a href="https://jagodwin.github.io/assets/papers/infovis17-poster-health.pdf">Poster Abstract</a></p>]]></content><author><name>Alex Godwin, Ph.D</name></author><category term="research" /><category term="publications" /><category term="conference" /><category term="poster" /><summary type="html"><![CDATA[A project focused on providing a quick and clear understanding of the current health inequities in Atlanta through cartograms and choropleth maps.]]></summary></entry><entry><title type="html">Nodes, Paths, and Edges: Using Mental Maps to Augment Crime Data Analysis in Urban Spaces</title><link href="https://jagodwin.github.io/research/mentalmaps/" rel="alternate" type="text/html" title="Nodes, Paths, and Edges: Using Mental Maps to Augment Crime Data Analysis in Urban Spaces" /><published>2017-06-12T00:00:00+00:00</published><updated>2017-06-12T00:00:00+00:00</updated><id>https://jagodwin.github.io/research/mentalmaps</id><content type="html" xml:base="https://jagodwin.github.io/research/mentalmaps/"><![CDATA[<p><img src="https://jagodwin.github.io/assets/images/mental_maps/balt-diff.png" alt="/img/mental_maps/balt-diff.png" /></p>

<p>Citizen participation can provide valuable insight into data that is not captured by official sources. In this paper, we propose a technique for using mental maps consisting of three fundamental elements: nodes, paths, and edges. These elements can be used to augment crime data analysis in urban spaces by incorporating the values and knowledge of citizens. We apply this technique to an analysis of property crime in three US cities: Baltimore, Atlanta, and Chicago. Subsequently, we find these cities have neighborhoods where the crime could be substantially higher—or perceived by citizens as higher—than is accounted for in the official public crime data. This analysis can be a vital first step for identifying hidden hotspots or better understanding public perceptions of high crime.</p>

<iframe src="https://player.vimeo.com/video/233066761?h=d3c4e852f5" width="640" height="360" frameborder="0" allow="autoplay; fullscreen; picture-in-picture" allowfullscreen=""></iframe>
<p><a href="https://vimeo.com/233066761">EuroVIS 2017: Nodes, Paths, and Edges: Using Mental Maps to Augment Crime Data Analysis in Urban Spaces</a> from <a href="https://vimeo.com/vgtcommunity">VGTCommunity</a> on <a href="https://vimeo.com">Vimeo</a>.</p>

<h2 id="authors">Authors</h2>
<p>Godwin, A. and Stasko, J.</p>

<h2 id="venue">Venue</h2>
<p><a href="https://www.eurovis.org/">Proceedings of EuroVis ‘17</a></p>

<h2 id="materials">Materials</h2>
<p><a href="https://jagodwin.github.io/assets/papers/2017_Godwin_NPM-MentalMaps.pdf">Paper</a></p>]]></content><author><name>Alex Godwin, Ph.D</name></author><category term="research" /><category term="publications" /><category term="conference" /><category term="short" /><category term="paper" /><summary type="html"><![CDATA[Citizen participation can provide valuable insight into data that is not captured by official sources. In this paper, we propose a technique for using mental maps consisting of three fundamental elements: nodes, paths, and edges.]]></summary></entry><entry><title type="html">TypoTweet Maps: Characterizing Urban Areas through Typographic Social Media Visualization</title><link href="https://jagodwin.github.io/research/typotweet/" rel="alternate" type="text/html" title="TypoTweet Maps: Characterizing Urban Areas through Typographic Social Media Visualization" /><published>2017-06-12T00:00:00+00:00</published><updated>2017-06-12T00:00:00+00:00</updated><id>https://jagodwin.github.io/research/typotweet</id><content type="html" xml:base="https://jagodwin.github.io/research/typotweet/"><![CDATA[<p><img src="https://jagodwin.github.io/assets/images/ttm/thumb-crop.png" alt="Typo Tweet Map of Atlanta" /></p>

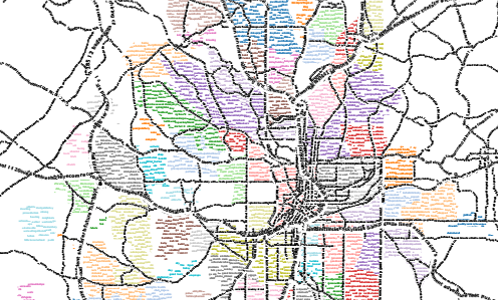
<p>Analyzing the important events and news stories that have captured the public interest in a city can be useful for determining the topics that are vital to the people that live there. Social media data, such as tweets, provides a useful and ever-churning feed of data to analyze for this purpose. For even a moderately-sized city, however, individual neighborhoods can have very different characteristics from one another. Geotagged tweets can be a rich data source for determining what people are saying online about the location they are in. Relating the text data to spatial location, however, presents a unique challenge in representation and layout. In this paper, we introduce TypoTweet Maps: a technique for constructing representations of neighborhood topics as typographic maps. TypoTweet Maps show differences in neighborhood topics using only text, avoiding the channel interference of feature labels that are unnecessary for residents who are familiar with the shape of the city. We describe the process of mapping geotagged tweets to the shape of neighborhoods and streets, and present a case study applying the technique to the city of Atlanta.</p>

<iframe src="https://player.vimeo.com/video/233067283?h=156a0f885a" width="640" height="360" frameborder="0" allow="autoplay; fullscreen; picture-in-picture" allowfullscreen=""></iframe>
<p><a href="https://vimeo.com/233067283">EuroVIS 2017: TypoTweet Maps: Characterizing Urban Areas through Typographic Social Media Visualization</a> from <a href="https://vimeo.com/vgtcommunity">VGTCommunity</a> on <a href="https://vimeo.com">Vimeo</a>.</p>

<h2 id="authors">Authors</h2>
<p>Godwin, A., Wang Y., and Stasko, J.</p>

<h2 id="venue">Venue</h2>
<p><a href="https://www.eurovis.org/">Proceedings of EuroVis ‘17</a></p>

<h2 id="materials">Materials</h2>
<p><a href="https://jagodwin.github.io/assets/papers/2017_Godwin_TTM-SocialMedia.pdf">Paper</a></p>]]></content><author><name>Alex Godwin, Ph.D</name></author><category term="research" /><category term="publications" /><category term="conference" /><category term="short" /><category term="paper" /><summary type="html"><![CDATA[Geotagged tweets can be a rich data source for determining what people are saying online about the location they are in. In this paper, we introduce TypoTweet Maps: a technique for constructing representations of neighborhood topics as typographic maps.]]></summary></entry><entry><title type="html">HotSketch: Drawing Police Patrol Routes among Spatiotemporal Crime Hotspots</title><link href="https://jagodwin.github.io/research/hotsketch/" rel="alternate" type="text/html" title="HotSketch: Drawing Police Patrol Routes among Spatiotemporal Crime Hotspots" /><published>2017-01-04T00:00:00+00:00</published><updated>2017-01-04T00:00:00+00:00</updated><id>https://jagodwin.github.io/research/hotsketch</id><content type="html" xml:base="https://jagodwin.github.io/research/hotsketch/"><![CDATA[<p><i class="fas fa-award" aria-hidden="true"></i> <em>Best Paper Honorable Mention</em></p>

<p><img src="https://jagodwin.github.io/assets/images/hotsketch.png" alt="/img/mental_maps/balt-diff.png" /></p>

<p>During the course of a day, a police unit is expected to move throughout the city to provide a visible presence and respond quickly to emergencies. Planning this movement at the beginning of the shift can provide a helpful first step in ensuring that officers are present in areas of high crime, but these plans can quickly break down as they are pulled away to 911 calls. Once such an initial plan is deferred, police units need to be able to rapidly and fluidly decide where to go next depending on their immediate location and time. In this paper, we present our research to couple spatiotemporal analysis of historical crime data with sketch-based interaction methods. This research is presented through an initial prototype, HotSketch, which we describe through a set of use cases within the domain of police patrol route planning.</p>

<h2 id="authors">Authors</h2>
<p>Godwin, A. and Stasko, J.</p>

<h2 id="venue">Venue</h2>
<p><a href="https://hicss.hawaii.edu/">2017 Proceedings of the 50th Hawaii International Conference on System Sciences</a></p>

<h2 id="materials">Materials</h2>
<p><a href="https://jagodwin.github.io/assets/papers/hicss17-hotsketch.pdf">Paper</a></p>]]></content><author><name>Alex Godwin, Ph.D</name></author><category term="research" /><category term="publications" /><category term="conference" /><category term="paper" /><summary type="html"><![CDATA[In this paper, we present our research to couple spatiotemporal analysis of historical crime data with sketch-based interaction methods.]]></summary></entry></feed>