
Visualization for On and Off the Rails: Train Commuting Dashboards for DC
Our work on public train visualization will be presented at IEEE VIS in Oklahoma City! This is student-led work by two amazing undergraduate students, Jacob Rosen and Jeff Zhang. This started as a student project in my InfoVis class and they did a fantastic job in getting it ready for VIS.
Abstract
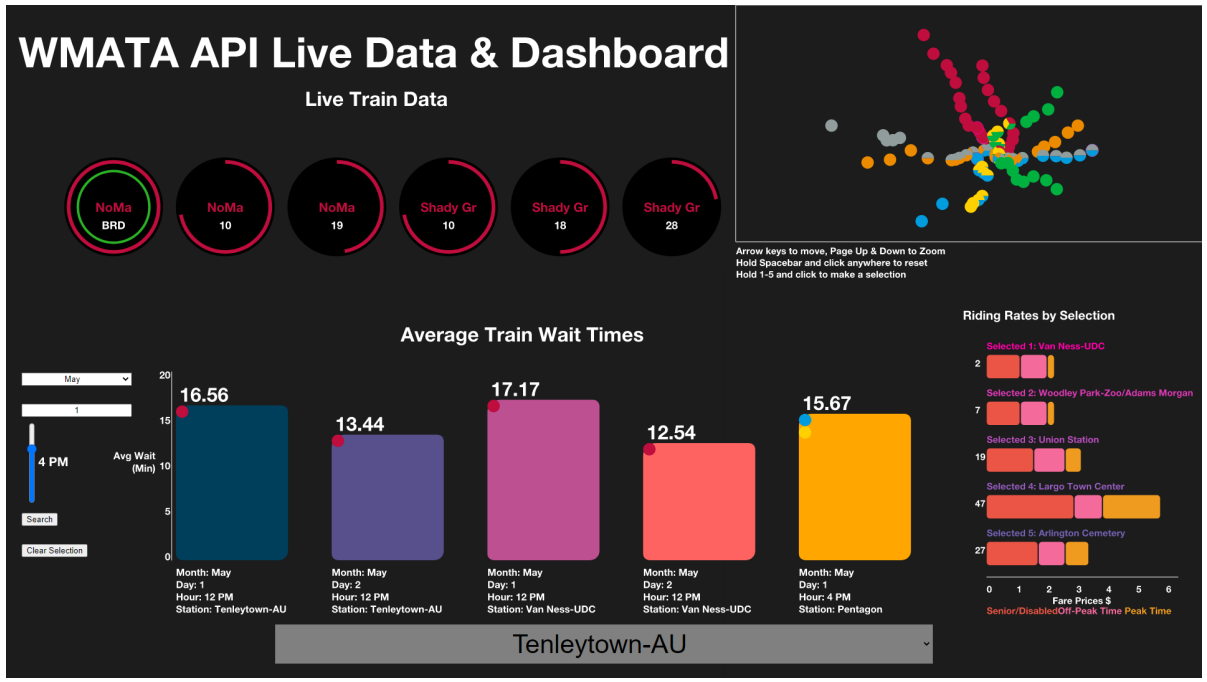
The Metro API Data Visualization project (MetroVis) balances passive display capabilities for commuters with interactive queries to visualize Washington Metropolitan Area Transit Authority’s (WMATA) live and historic transportation data. MetroVis is designed for commuters of two types: those that have to rapidly make decisions and catch a train, and those that have a moment to wait.For commuters that have to rapidly determine which train is arriving and how much time they have to catch it, MetroVis displays relevant information about a location that can be discerned at a glance. For commuters that have a moment to interact with the display while waiting for a train, MetroVis presents several dynamic and interactive features that allow commuters to quickly find information