
TypoTweet Maps: Characterizing Urban Areas through Typographic Social Media Visualization
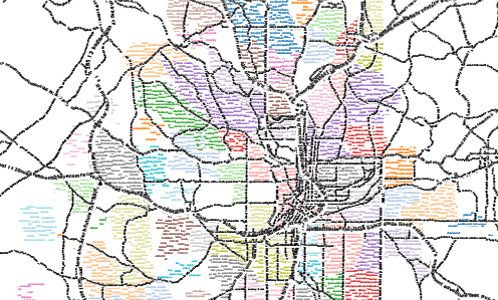
Analyzing the important events and news stories that have captured the public interest in a city can be useful for determining the topics that are vital to the people that live there. Social media data, such as tweets, provides a useful and ever-churning feed of data to analyze for this purpose. For even a moderately-sized city, however, individual neighborhoods can have very different characteristics from one another. Geotagged tweets can be a rich data source for determining what people are saying online about the location they are in. Relating the text data to spatial location, however, presents a unique challenge in representation and layout. In this paper, we introduce TypoTweet Maps: a technique for constructing representations of neighborhood topics as typographic maps. TypoTweet Maps show differences in neighborhood topics using only text, avoiding the channel interference of feature labels that are unnecessary for residents who are familiar with the shape of the city. We describe the process of mapping geotagged tweets to the shape of neighborhoods and streets, and present a case study applying the technique to the city of Atlanta.
EuroVIS 2017: TypoTweet Maps: Characterizing Urban Areas through Typographic Social Media Visualization from VGTCommunity on Vimeo.
Authors
Godwin, A., Wang Y., and Stasko, J.