
Making Public Safety Data Accessible in the Westside Atlanta Data Dashboard
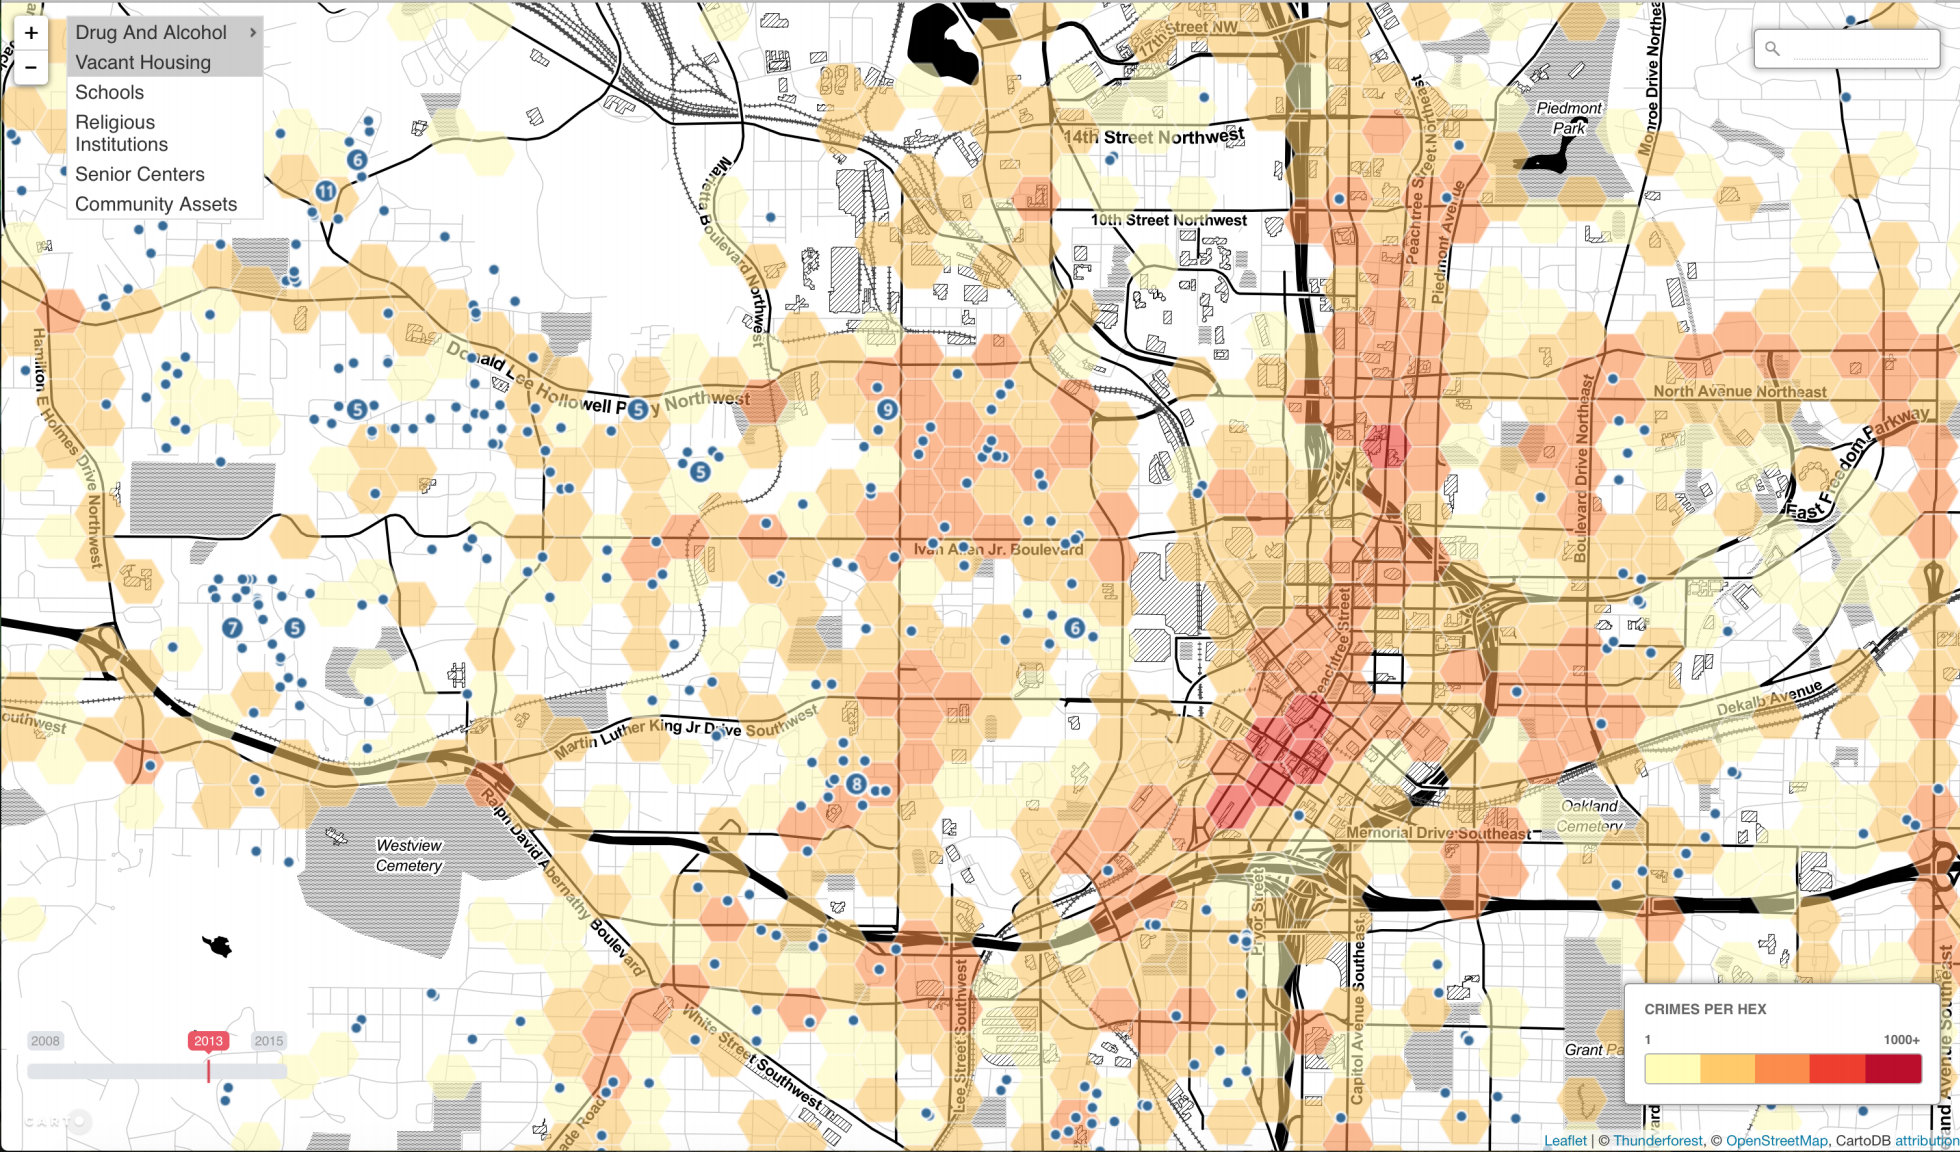
Individual neighborhoods within large cities can benefit from independent analysis of public data in the context of ongoing efforts to improve the community. Yet existing tools for public data analysis and visualization are often mismatched to community needs, for reasons including geographic granularity that does not correspond to community boundaries, siloed data sets, inaccurate assumptions about data literacy, and limited user input in design and implementation phases. In Atlanta this need is being addressed through a Data Dashboard developed under the auspices of the Westside Communities Alliance (WCA), a partnership between Georgia Tech and community stakeholders. In this paper we present an interactive analytic and visualization tool for public safety data within the WCA Data Dashboard. We describe a human-centered approach to understand the needs of users and to build accessible mapping tools for visualization and analysis. The tools include a variety of overlays that allow users to spatially correlate features of the built environment, such as vacant properties with criminal activity as well as crime prevention efforts. We are in the final stages of developing the first version of the tool, with plans for a public release in fall of 2016.
Authors
Katie O’Connell (Georgia Institute of Technology), Yeji Lee (Georgia Institute of Technology), Firaz Peer (Georgia Institute of Technology), Shawn M. Staudaher (University of Wyoming), Alex Godwin (Georgia Institute of Technology), Mackenzie Madden (Georgia Institute of Technology), Ellen Zegura (Georgia Institute of Technology)
Venue
Bloomberg Data for Good Exchange